Understanding Your Dexa Body Composition Results

In today's health-conscious world, understanding your body composition goes beyond just weight and height. Tools like DEXA body composition scans provide detailed insights into various components that make up your body, offering valuable information for assessing health and fitness. Let's look into what information a DEXA body composition scan gives you, and how it can be beneficial.
What is Body Composition and why does it matter?
Body composition refers to the proportion of different components that make up a person's body, typically categorized into fat mass and fat-free mass.
Fat-free Mass
Fat-free mass (FFM), also known as lean body mass, comprises all non-fat tissues and substances in the body. It includes:
Muscle Tissue
Bone Tissue
Organs
Water
Connective Tissue
Fat Mass
Fat mass can be broken down into two types of fat
Subcutaneous fat: this is the fat found just beneath your skin. It primarily serves as a storage site of excess energy and as a layer of insulation. While excessive subcutaneous fat may contribute to obesity-related health issues such as joint problems and reduced mobility, it is generally considered less harmful than visceral fat in terms of metabolic health.
Visceral Fat: this is the fat surrounding your organs. Visceral fat is more metabolically active than subcutaneous fat and can release fatty acids into the bloodstream, affecting liver function and insulin resistance. High levels of visceral fat are strongly associated with an increased risk of metabolic syndrome, type 2 diabetes, cardiovascular disease, and other chronic health conditions.
Body composition is important to know and measure because:
Health Indicators: Body composition can indicate risks associated with excessive visceral fat mass, such as cardiovascular diseases, diabetes, and other metabolic disorders. It also reflects muscle mass, which is crucial for strength, mobility, and metabolic health.
Fitness and Performance: Athletes and fitness enthusiasts monitor body composition to optimize performance. Muscle mass contributes to strength and endurance, while a healthy ratio of fat mass to lean mass improves agility and overall athletic performance.
Weight Management: Understanding body composition helps in setting realistic weight loss or weight gain goals. Simply losing weight on a scale does not necessarily mean improved health if it leads to loss of muscle mass or inadequate fat loss.
Nutritional Needs: Different body compositions may have varying nutritional requirements. For instance, individuals with higher muscle mass may need more protein to support muscle growth and repair.
Monitoring Progress: Tracking changes in body composition provides feedback on the effectiveness of diet and exercise routines. It allows individuals to make adjustments to achieve desired health or fitness outcomes.
Body Composition Results

As you can see, the results of your body composition are broken down into each arm, leg, your trunk and your head. Remember the Lean + BMC is the weight of your bones, muscles, organs and connective tissue, not just your muscles alone.
On the right you will see two results labeled %Fat Percentile YN and AM.
YN stands for “Young Normal.” This is a comparison of how much fat mass you have compared to a young healthy person of the same sex.
An easy way to think of this with the above results is; if you are in a room with 99 other people who are the same gender, but they are between 20-30 years old, 91 of them would have total fat % lower than you and 8 would have a total fat % higher than you.
AM stands for “Age Matched.” This is a comparison of how much fat mass you have compared to a person who is the same age and sex as you.
An easy way to think of this with the above results is; if you are in a room with 99 people who are the same gender and age, 89 of them would have a total fat % lower than you and 10 would have a total fat % higher than you.
Android and Gynoid regions

The android region includes your lower chest and waist. (Left)
The gynoid region includes your hips, thighs and buttocks. (Right)
How Much Body Fat Percentage Should You Have
The ideal body fat percentage varies between men and women due to differences in physiology and hormonal composition. For men, a healthy range typically falls between 10-20% body fat, where lower percentages are often associated with better fitness and health outcomes. Women, on the other hand, tend to have higher essential fat requirements, with a healthy range generally falling between 20-30% body fat. These ranges can vary based on individual factors such as age, fitness level, and genetics. It's important to note that both too little and too much body fat can pose health risks, making it crucial to strive for a balanced approach to body composition.
Body Mass Index (BMI)

BMI is a commonly used metric calculated by dividing a person's total weight (in kilograms) by the square of their height (in meters.) It's used as a screening tool to categorize individuals into underweight, normal weight, overweight, or obese categories. However, BMI doesn't differentiate between fat mass and lean mass, nor does it consider distribution of fat, muscle mass, bone density or sex.

A BMI below 18.5 is classified as underweight, indicating potential risks such as nutrient deficiencies and weakened immune function. A BMI between 18.5 and 24.9 falls within the normal weight range, associated with lower health risks and optimal overall health. BMIs ranging from 25 to 29.9 are classified as overweight, indicating increased risk for conditions like heart disease and diabetes. A BMI of 30 or higher falls into the obesity category, correlating with higher risks of serious health issues such as stroke, certain cancers, and osteoarthritis.

Fat Mass Index (FMI)
The Fat Mass Index (FMI) is a measure used to assess the amount of fat mass relative to an individual's height. Similar to Body Mass Index (BMI), which relates weight to height, FMI specifically focuses on fat mass. It is calculated by dividing total fat mass (in kilograms) by the square of height (in meters). FMI provides a more nuanced understanding of body composition than BMI alone, helping to distinguish between individuals with similar BMI but varying levels of fat mass. It is also broken down by male and female as the healthy amount of fat is different between genders.


Men should aim for a FMI between 3 and 6 while women should aim for an FMI between 5 and 9.
Essential body fat, which is necessary for normal physiological functioning, tends to be higher in women to support menstrual cycles, fertility, and pregnancy. Additionally, women have a higher proportion of essential fat stored in breasts, pelvis, and thighs, crucial for reproductive health and hormone regulation. This biological need for higher body fat levels in women ensures proper energy reserves and supports hormonal balance essential for reproductive health and overall well-being.
Lean Mass Index (LMI)
The Lean Mass Index (LMI) is a measurement used to assess the amount of lean body mass relative to an individual's height. Lean body mass includes muscles, bones, organs, water, and other non-fat tissues in the body. LMI is calculated by dividing total lean body mass (in kilograms) by the square of height (in meters). Similar to Body Mass Index (BMI) and Fat Mass Index (FMI), LMI provides a way to evaluate body composition beyond just weight and fat mass.


There is no reference range for lean mass index like there is for BMI and FMI. In general the higher the number the better. The results are provided in a percentile comparing you to others in a reference population.
YN stands for “Young Normal.” This is a comparison of how much lean mass you have compared to a young healthy person of the same sex.
An easy way to think of this with the above results is; if you are in a room with 99 other people who are the same gender, but they are between 20-30 years old, 39 of them would have less lean mass than you and 60 would have more lean mass than you.
AM stands for “Age Matched.” This is a comparison of how much lean mass you have compared to a person who is the same age and sex as you.
An easy way to think of this with the above results is; if you are in a room with 99 people who are the same gender and age, 31 of them would have less lean mass than you and 68 would have more lean mass than you.
Appendicular Lean Mass Index (ALMI)
Appendicular Lean Mass Index (ALMI) is a measurement used to assess the amount of lean body mass in the arms and legs relative to an individual's height. It focuses specifically on the lean muscle mass in the appendages (arms and legs) and is calculated by dividing the total lean mass of the arms and legs (in kilograms) by the square of height (in meters).


Like the lean mass index, there are no established ideal values, so the results are given as a percentile reference compared to others. The higher the number the better.
High ALMI (Appendicular Lean Mass Index) is important because it indicates a greater proportion of lean muscle mass relative to body size, which is crucial for overall health and functional independence. Lean muscle mass plays a vital role in supporting metabolic function, strength, mobility, and bone density. Maintaining a higher ALMI is associated with better physical performance, reduced risk of falls and fractures, and improved quality of life, especially in older adults.
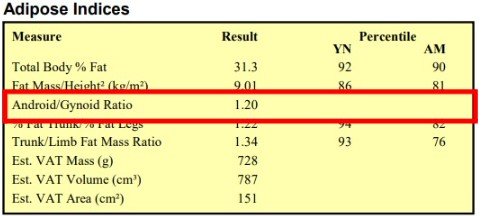
Android/Gynoid Ratio
The android/gynoid ratio is a measure used to assess body fat distribution patterns by comparing the amount of fat stored in android (upper body, particularly around the abdomen) versus gynoid (lower body, typically around the hips and thighs) regions. This ratio provides insights into the distribution of body fat .
Values above 1 indicate a more centralized, apple-shaped body type (android obesity), which is associated with increased risks of metabolic disorders such as insulin resistance, type 2 diabetes, and cardiovascular diseases.
Values below 1 suggest a more peripheral, pear-shaped body type (gynoid obesity), which is generally considered less metabolically harmful but can still impact overall health if fat accumulation is excessive.
Unfortunately there is nothing we can do to change where our body deposits fat stores or where fat comes off of our body as we decrease fat mass. Men tend to store more fat in the android region, and women tend to store more fat in the gynoid region. The best thing you can do is manage your overall body fat percentage and more importantly decrease your visceral fat stores.
Visceral Adipose Tissue (VAT)
Visceral fat refers to fat stored deep within the abdominal cavity around internal organs such as the liver, pancreas, and intestines. Unlike subcutaneous fat, which lies just beneath the skin, visceral fat is metabolically active and can release fatty acids into the bloodstream, affecting insulin sensitivity, blood lipid levels, and inflammation. Excess visceral fat is strongly associated with an increased risk of metabolic disorders, including type 2 diabetes, cardiovascular disease, and hypertension.

Est. VAT Mass (g) (VAT = Visceral Adipose Tissue) gives how many grams of fat you have around your organs. To convert this number to pounds simply divide the result by 454.

Visceral fat is assessed in terms of both volume and area, with a particular emphasis on area measurements. Research has predominantly linked the area of visceral fat to various disease risks. As a guideline, an estimated VAT Area (cm²) below 100 indicates low risk, while values between 100 and 160 indicate intermediate risk, and values exceeding 160 indicate high risk.

Bone Density
Bone density is crucial for overall skeletal health and resilience. It determines the strength of bones and their ability to withstand fractures and injuries, making it essential for maintaining mobility and quality of life, especially as we age. Monitoring and maintaining optimal bone density through lifestyle choices and medical interventions are key to preventing osteoporosis and other bone-related conditions.

The way bone density is measured is using a T-score and a Z-score. Both T-scores and Z-scores are crucial indicators used to assess bone health. With both scores, the higher the number the better.
T-scores compare an individual's bone density to that of a healthy young adult of the same sex and ethnicity. We only provide T-scores for those age 50 or older.
Z-scores, on the other hand, compare bone density to others in the same age group, sex, and ethnicity. They are useful in assessing bone density in younger individuals, children, and premenopausal women, providing context beyond typical aging-related changes.
Both T-scores and Z-scores are valuable tools for evaluating bone health. Body composition scans analyze the entire skeleton, and these values are not used to diagnose low bone density or osteoporosis. We are not a medical facility, and can not diagnose disease or give medical advice. If you are concerned about your values please take your report to your doctor so they can do an evaluation. Doctors use more specific tests on your spine, hip, or forearm for diagnostic purposes.
What to do with my Results
Body composition results are interesting on their own, but they are really useful in evaluating if your lifestyle changes are making the changes that you want.
Weight Loss
Losing weight effectively involves adopting a balanced approach that combines healthy eating habits, regular physical activity, and sustainable lifestyle changes. Focus on consuming a variety of nutrient-dense foods, such as fruits, vegetables, proteins, and whole grains, while minimizing processed foods and sugary drinks. Portion control and mindful eating can also help manage calorie intake. Incorporating regular exercise, including aerobic activities like walking or jogging, along with strength training to build muscle and boost metabolism, is essential. Additionally, getting adequate sleep, managing stress levels, and staying hydrated are important for overall health and successful weight loss. It's crucial to set realistic goals and make gradual changes to foster long-term success and maintain a healthy weight.
Increasing Muscle Mass
Building muscle mass effectively requires a combination of targeted resistance training, proper nutrition, and adequate recovery. Engage in strength training exercises that target major muscle groups, such as weightlifting, bodyweight exercises, or resistance band workouts, at least 2-3 times per week. Focus on progressively increasing resistance or intensity to challenge muscles and stimulate growth. Nutrition plays a crucial role, so ensure a diet rich in proteins to support muscle repair and growth, along with complex carbohydrates and healthy fats for energy and overall health. Adequate protein intake, spread throughout the day, is key. Allow muscles time to recover with sufficient sleep and rest days between workouts, as muscles grow and repair during rest periods. Consistency, proper form, and patience are essential in building muscle mass safely and effectively over time.
Increasing and Maintaining Bone Density
Increasing bone density is achievable through a combination of weight-bearing exercises, adequate intake of calcium and vitamin D, and maintaining a healthy lifestyle. Engaging in activities like walking, jogging, dancing, help maintain bone density while strength training and resistance exercise can stimulate bone formation and help preserve existing bone mass. Consuming a balanced diet rich in calcium from sources like dairy products, leafy greens, and fortified foods, along with vitamin D from sunlight and supplements as needed, supports bone health. Avoiding smoking and excessive alcohol consumption is also beneficial, as these habits can weaken bones.
In summary
Regular DEXA body composition scans are essential for tracking changes in body fat, lean muscle mass, and bone density over time. These scans provide valuable insights into health progress, guiding adjustments in diet, exercise, and lifestyle habits as needed. For most individuals, especially those monitoring weight loss or muscle-building efforts, regular DEXA scans are recommended to assess progress accurately and adjust goals accordingly. Routine DEXA scans empower individuals to make informed decisions about their health, optimize fitness strategies, and maintain long-term wellness goals effectively.
References
U.S. Nuclear Regulatory Commission (NRC). (n.d.). Radiation Doses in Our Daily Lives. Retrieved July 8, 2024, from https://www.nrc.gov/about-nrc/radiation/around-us/doses-daily-lives.html
American Cancer Society. (n.d.). Understanding Radiation Risk from Imaging Tests. Retrieved July 8, 2024, from https://www.cancer.org/cancer/diagnosis-staging/tests/imaging-tests/understanding-radiation-risk-from-imaging-tests.html
Mittal B. Subcutaneous adipose tissue & visceral adipose tissue. Indian J Med Res. 2019 May;149(5):571-573. doi: 10.4103/ijmr.IJMR_1910_18. PMID: 31417024; PMCID: PMC6702693.
Gesta S, Tseng YH, Kahn CR. Developmental origin of fat: tracking obesity to its source. Cell. 2007 Oct 19;131(2):242-56. doi: 10.1016/j.cell.2007.10.004. Erratum in: Cell. 2008 Oct 17;135(2):366. PMID: 17956727.
Tchernof A, Després JP. Pathophysiology of human visceral obesity: an update. Physiol Rev. 2013 Jan;93(1):359-404. doi: 10.1152/physrev.00033.2011. PMID: 23303913.
Després JP, Lemieux I, Prud'homme D. Treatment of obesity: need to focus on high risk abdominally obese patients. BMJ. 2001 Mar 24;322(7288):716-20. doi: 10.1136/bmj.322.7288.716. PMID: 11264213; PMCID: PMC1119905.
Kelly TL, Wilson KE, Heymsfield SB. Dual energy X-Ray absorptiometry body composition reference values from NHANES. PLoS One. 2009 Sep 15;4(9):e7038. doi: 10.1371/journal.pone.0007038. PMID: 19753111; PMCID: PMC2737140.
Björntorp P. Visceral obesity: a "civilization syndrome". Obes Res. 1993 May;1(3):206-22. doi: 10.1002/j.1550-8528.1993.tb00614.x. PMID: 16350574.
Sironi AM, Gastaldelli A, Mari A, Ciociaro D, Positano V, Buzzigoli E, Ghione S, Turchi S, Lombardi M, Ferrannini E. Visceral fat in hypertension: influence on insulin resistance and beta-cell function. Hypertension. 2004 Aug;44(2):127-33. doi: 10.1161/01.HYP.0000137982.10191.0a. Epub 2004 Jul 19. Erratum in: Hypertension. 2004 Nov;44(5):e8. Postano, Vincenzo [corrected to Positano, Vincenzo]. PMID: 15262911.
Westerterp, Klaas R., and Maria AM Goris. "Relationship between physical activity and energy expenditure in a representative sample of young women." American Journal of Clinical Nutrition 73.6 (2001): 1224-1230.
Wells, J. C. K. "Sexual dimorphism of body composition." Best Practice & Research Clinical Endocrinology & Metabolism 21.3 (2007): 415-430.
Kim, Kyoung Min, et al. "Low appendicular lean mass is associated with osteoporotic fractures in postmenopausal Korean women: the 2008–2010 Korea National Health and Nutrition Examination Survey (KNHANES)." The Journal of Clinical Endocrinology & Metabolism 98.5 (2013): 1910-1917.
American Council on Exercise (ACE). (n.d.). Body fat percentage chart: ACE's recommendations for optimal body fat percentage for health and fitness. Retrieved from https://www.acefitness.org/education-and-resources/lifestyle/blog/112/what-are-the-guidelines-for-percentage-of-body-fat-loss